Reservoir Management

Residency Time

Residency time

Establish whether your reservoir is performing as expected, enabling you to better understand your assets and their real-world performance.

Rainwater Ingress

Rainwater Ingress

Understand the health of your reservoirs, leading to better asset management, better maintenance planning and longer asset life.

Events

Detection

Detection

Patented data analytics point you in the direction of unusual network activity, saving you time in analysing the data and ensuring you are aware when something happens.

Classification

Classification

Our analytics classify events to help you understand what has happened, so you can respond effectively to any problems.

Notifications

Notifications

Our flexible notifications system means you see what you need to, when you need to and in a way that fits with you. All notifications are integrated into our Insight platform for a seamless experience.

Propagation

Propagation

Understanding where an event originated is key to finding a solution. Understanding where it is going is key to responding effectively. Our platform enables you to see event propagation so you can find the cause and the correct response.

Water sources

Powerful Analytics

Powerful Analytics

Our analytics uses the multi-parameter data collected from the network to track the water source signature throughout the network. Providing you with the information of where your water came from.

Mixing across the network

Mixing across the network

When a network uses multiple water sources, it can be difficult to understand which source a customer is using. Our visualisation tools, alongside our analytics, enable you to see the distribution of your source water around your network.

Model validation

Model validation

Ensuring you can trust the output of your models is key to effective network management. Our Insight platform gives you the tools to compare your model’s prediction of water source distribution.

Network Analysis

Disinfectant levels

Disinfectant levels across the network

Understand how your disinfectant levels vary throughout your network. From treatment works to customer tap, does the disinfectant level remain high enough or too high? Does it dissipate slowly or rapidly?
Water Quality

Water quality hotspots

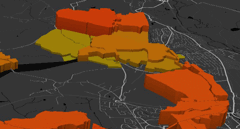
Identify where your water quality hotspots are, so you can address the root cause of quality issues in your networks.
KPI monitoring

KPI monitoring

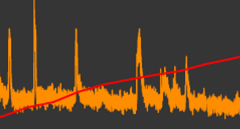
How does your performance compare to previous months? Our KPIs take sensor data and intuitively relate this to the real-world of customer experience and maintenance performance so you can see how you are improving over time.
Outcomes

  • Extended reservoir life
  • Reduce customer contacts
  • Network visibility
  • Live WQ compliance
  • Source water tracing
  • Improved incident response

Benefit for each reservoir

£2m cost of new
reservoir
50 yrs expected life
of reservoir
Vs
£20,000 approximate cost of
monitoring reservoir
5 yrs additional life
£200,000 savings from additional reservoir life ROI 900%

Demand analysis

Normal and peak demands

Normal and peak demands

We analyse the demands in your network to help you understand the normal and peak demands, helping you to plan ahead and understand the behaviour of your consumers.

Improve network model accuracy

Improve network model accuracy

Through our demand analysis you can ensure that the demands used by your models reflect what is experienced in the real-world.

Leak analysis

Detection & Classification

Detection & Classification

Our advanced AI analytics detect and classify any changes so you understand whether there is a genuine leak or just a demand increase, to help you know when and how to respond.

Prioritisation

Prioritisation

We calculate the size of the water loss so you can prioritise repairs and ensure that the most severe leaks are addressed first.

Localisation

Localisation

In order to fix leaks, you need to know where they are. Through our Insight platform, we can localise the leak to guide your teams to where they need to be.

Sensor advantages

Sensor Advantages

All-in-one

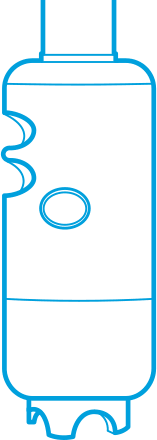
Our multiparameter sensors enable you to tackle water quality and leakage at the same time, saving on installation, maintenance and equipment costs.

Direct-insertion

Our sensors are installed through standard fittings without the need to cut the pipe. Ensuring cost effective installations compared to mag-flow sensors.
Supporting data

Historical analysis

Historical analysis

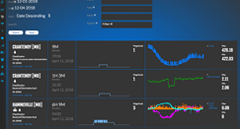
We can analyse historical network data to highlight areas where you may still have undetected leaks.
3rd party data

3rd party data

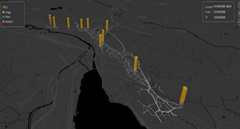
We can perform our analytics on existing sensors enabling you to get better value from your existing assets.
Nightly flows

Nightly flows

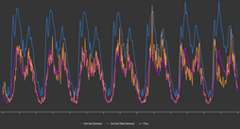
We calculate minimum nightly flows to help you analyse small leaks and changes in the underlying demands.

Outcomes

  • Reduce non-revenue water loss
  • Prioritised pipe repairs
  • Hydraulic model validation
  • Understand consumer behaviour
  • Utilise historical data
  • Combined water quality and leakage monitoring

Leakage management

Comparison between network deployment costs of hydraulic and water quality sensors compared to single solution.


£10,000 Mag flow sensor
(18 inch)
£3,000 Water quality
sensor
£30,000 Ground Works
& installation
Deployment x70
Vs
£10,000 intellisonde
£3,000 Pipe Tapping
and chamber
X 70 for full network
deployment
ROI 77% for each multi parameter sensor deployment

Characterising Discolouration

Sediment

Material breaks off upstream and collects on the floor of the pipe, usually due to poor hydraulics

Propagation

Material originates upstream and is carried to the site – further analysis is required upstream to establish exact cause

Film Shearing

Material breaks off locally at high shear, it is possible to identify a critical shear stress at which the breakdown begins

Conditioned

Discolouration rarely occurs locally. Only occurs at sites with a good variation in flow or well maintained pipes and assets
Understanding Discolouration using Insight

Customer contact hot spots

Customer contact hot spots

Know where customer complaints are but not where or what the source is?

Our Discolouration Management toolbox

Areas of analysis

Areas of analysis

  • Network resilience to discolouration
  • Mains cleaning program performance
  • Critical shear stress predictions
  • Regeneration rates
  • Pipe condition characterisation
Customer contact hot spots

Areas of analysis

  • Network resilience to discolouration
  • Mains cleaning program performance
  • Critical shear stress predictions
  • Regeneration rates
  • Pipe condition characterisation

Detecting Discolouration Sensor Requirements

Detecting Discolouration Sensor Requirements
  • Highly Stable and Sensitive turbidity measurements (primarily analysing variations of less than 0.05 NTU)
  • Flow Monitored at the same location as the Turbidity
  • Direct Insertion (In-Pipe) Monitoring (flow cell/bypass devices introduce a delay invalidates the analysis)
  • High Sampling Rate (a minimum of every 2 minutes)

Outcomes

  • Regulatory compliance
  • Reduce customer contacts
  • Self conditioning networks
  • Prioritise asset maintenance planning
  • Optimised network hydraulics
  • Extend life of distribution mains

Discolouration management

Example costs related to management of discolouration issues by water companies over an AMP period:

£30m 110km pipeline
replacement
£10m Mains cleaning
programme
£5m DWI notices
and penalties
Total £45m
Vs
£5m Smart Network Monitoring investment
based on 300 sensor deployment
£25m Projected saving
over AMP
ROI 500%

Industry data suggests 30 - 40% of replaced distribution mains pipe has useful remaining life.

Virtual DMAs

Virtual DMAs

Installing DMAs usually requires shutting off of valves and placing mag-flow sensors on the routes in and out. This incurs significant costs through modelling, valve placement and meter installations. In comparison, a virtual DMA can be created through direct insertion sensors and does not require isolation.

Through virtual DMAs we can offer leakage monitoring, zone analysis and an understanding of demands. This provides many of the benefits of DMAs in a more cost-effective solution.

Pressure analysis

Supply loss & low pressure

Supply loss & low pressure

Through analysing the pressure across the network, you can identify areas where the pressure is too low or even cut off. This enables you to quickly address these issues and reinstate supply faster.

High pressure and Pump optimisation

High pressure and Pump optimisation

Running pumps at high pressures can create higher running costs and puts greater strain on the pumps and pipes. Our platform helps you assess your pump levels and whether you can reduce them, resulting in longer asset life, reduced energy use and reduced maintenance costs.

Pressure transients

Pressure transients

Using our transient sensors and Insight platform, it is possible to identify areas experiencing undue stress on the assets. By identifying and addressing this you can extend your asset life and reduce maintenance costs.

Valve monitoring

PRV optimisation

PRV optimisation

Through monitoring and analysing PRVs our platform is able to show you which PRVs are not providing the correct pressures – ensuring your assets continue performing as needed.

Non-return valve operation

Non-return valve operation

Using our hydraulic sensors, we have identified many cases of faulty non-return valves. This can cause reservoirs to drain unexpectedly, leading to supply issues. Through our platform these are easily identified and addressed.

Network optimisation

Stagnation regions

Our sensors offer excellent low flow performance, alongside multiple parameters, enabling detection of stagnant regions. This helps you address these areas through dynamic network management or reconfiguration of valves to avoid water quality issues associated with stagnation.

Configuration checking

Often networks are not configured as expected as there are so many variables to account for and so much maintenance being performed that understanding the exact configuration can be challenging. Through our solution we can help you understand your network configuration and the real-world performance.
Outcomes

  • Live loss of supply notification
  • Reduced customer disruption
  • Demand pattern analysis
  • Hydraulic model accuracy
  • Reduced energy consumption
  • Virtual DMA’s

ROI

£60,000 DMA cost
£3.6m Network
deployment
Vs
£40,000 Virtual DMA cost
£2.4m Virtual DMA
Network Deployment
ROI 50% Savings £1.2m

What we provide

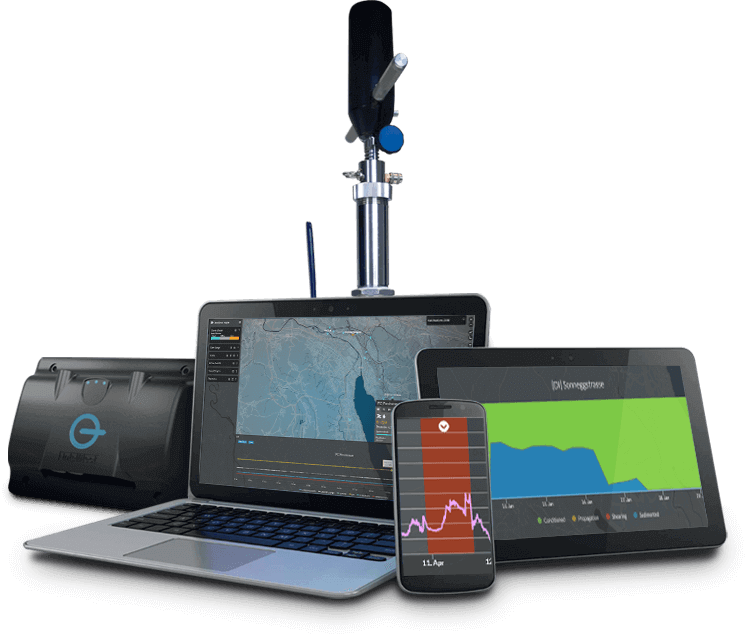
An end to end solution of sensors and smart components for water distribution networks.

More

The benefits to you

  • Online network monitoring
  • Real-Time network intelligence
  • Safe, high quality water
  • Root cause analysis tools
  • Totex efficiency
  • Network asset management

Our Clients

Talk to us

A complete solution from one supplier. Start realising the benefits.

Contact sales